YOU’VE HEARD THAT SAID so often, maybe it doesn’t seem worth investigating. With 2008 still fresh in most investors’ minds, it may seem sacrilegious to even question this. (Another odd behavioral quirk: Stocks were up huge in 2009 and 2010, flattish in 2011, and up again in 2012 as I write. Yet the bad returns five years back loom so much larger in our brains than the four subsequent years of overall big positive returns.)
But those beliefs that are so widely, broadly, universally held are often those that end up being utterly wrong—even backward.
Go ahead. Ask, “Are they?”
And initially, it may seem intuitive that plodding bonds are safer than stocks with their inherent wild wiggles. But I say, whether bonds are safer or not can depend on what you mean by “safe.”
There’s no technical definition—there’s huge room for interpretation. For example, one person might think “safe” means a low level of expected shorter-term volatility. No wiggles! Another person might think “safe” means an increased likelihood he achieves long-term goals, which may require a higher level of shorter-term volatility.
People often make the error of thinking bonds aren’t volatile. Not so. Bonds have price volatility, too. And their prices move in inverse relationship to interest rates. When interest rates rise, prices of currently issued bonds fall, and vice versa. So from year to year, as interest rates for varying categories of bonds move up and down, their prices move down and up. Some categories of bonds are more volatile than others—but in any given year, bonds can have negative returns—even US Treasurys.
But overall, as a broader category, bonds typically aren’t as volatile as stocks—over shorter time periods.
That’s an important caveat. Over shorter time periods like a year or even five, bonds are less volatile. They have lower expected returns, too. But if your exclusive goal is avoiding much volatility, and you don’t care about superior long-term returns, that may not bother you.
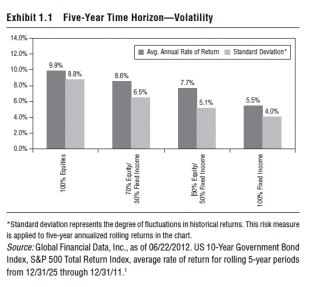
Exhibit 1.1 shows average annual returns and standard deviation (a common measure of volatility) over five-year rolling periods. It’s broken into a variety of allocations, including 100% stocks, 70% stocks/30% fixed income, 50%/50% and 100% fixed income.
Returns were superior for 100% stocks. And, not surprising, average standard deviation was higher for 100% stocks than for any allocation with fixed income—meaning stocks were more volatile on average. The more fixed income in the allocation over rolling five-year periods, the lower the average standard deviation.
So far, I haven’t said anything that surprises you. Stocks are more volatile than bonds.
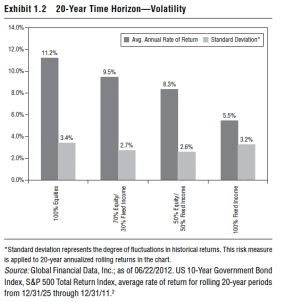
But hang on—if you increase your observation period, something happens. Exhibit 1.2 shows the same thing as Exhibit 1.1, but over rolling 20-year periods. Standard deviation for 100% stocks fell materially and was near identical to standard deviation for 100% fixed income. Returns were still superior for stocks—but with similar historic volatility.
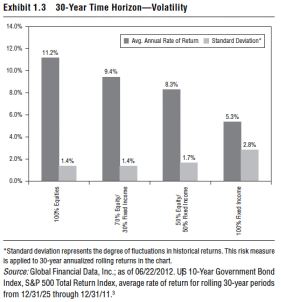
It gets more pronounced over 30-year time periods—shown in Exhibit 1.3. (If you think 30 years is an impossibly long investing time horizon, see Chapter 2. Investors commonly assume a too-short time horizon—a 30-year time horizon likely isn’t unreasonable for most readers of this book.) Over rolling 30-year periods historically, average standard deviation for 100% stocks was lower than for 100% fixed income. Stocks had half the volatility but much better returns!
Day to day, month to month and year to year, stocks can experience tremendous volatility—often much more than bonds. It can be emotionally tough to experience—but that higher shorter-term volatility shouldn’t surprise you. Finance theory says it should be so.
To get to stocks’ long-term superior returns over fixed income, you must accept a higher degree of shorter-term volatility. If stocks were less volatile year to year on average, their returns would likely be lower. Like bonds!
But given a bit more time, those monthly and yearly wild wiggles resolve into steadier and more consistent upward volatility. And yes, volatility goes both ways. You probably don’t hear this often (if ever), but data prove stocks have been less volatile than bonds historically over longer periods—and with superior returns.
If that’s the case, why do so many investors fear stocks? Easy: evolution.
It’s been proven that investors feel the pain of loss over twice as intensely as they enjoy the pleasure of gain. That’s from the Nobel Prize–winning behavioral finance concept of prospect theory. Another way to say that is it’s natural for danger (or perceived danger) to loom larger in our brains than the prospect of safety.
This evolved response no doubt treated our long-distant ancestors well. Folks who naturally fretted, constantly, the threat of attack by saber-toothed tigers were likely better off than their more lackadaisical peers. (The best way to win a fight with a saber-toothed tiger is not to get into one.) And those who had an outsized fear of the coming winter likely prepared better and faced lower freezing and/or starving risk. Hence, they more successfully passed on their more vigilant genes. But obsessing about future pleasantness or the absence of freezing risk didn’t really help perpetuate the species.
And our basic brain functioning just hasn’t changed that much in the evolutionary blink-of-an-eye since. Which is why it’s been proven a 10% portfolio loss feels about as bad to US investors on average as a 25% gain feels good. (European investors feel the pain of loss even more intensely.)
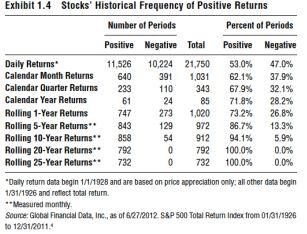
What has that to do with the common misperception stocks are just down a lot? Exhibit 1.4 shows how often stocks are positive versus negative over varying time periods. On a daily basis, the odds stocks are positive are slightly better than a coin flip. And negative days tend to come in clumps. Positive days, too! But because we’re hyper-aware of danger, the negative clumps loom bigger in our brains, even though that’s not what reality is.
Behaviorally, it can be very difficult not to think so short term. But if you can stretch your observation period just a bit longer, odds are good stocks will be positive. Stocks are positive historically in 62% of calendar months—though they come in clumps, too. Rolling 12-month periods are positive 73.2% of the time. And yet, media headlines and pundits hyperventilate as if there’s a bear lurking around every corner. What they should really fear is missing market upside (see Chapter 3), but that isn’t what comes naturally to our brains—which aren’t all that different from our distant ancestors’ caveman brains.
History is clear—stocks are positive much more than not on average. And over longer periods like 20 years or more, they’re actually less volatile than bonds. It can be difficult to overcome ingrained behavior and think that way, but if you can, the long-term rewards are likely to be better with stocks (if you have a well-diversified portfolio, of course) than with bonds.
But some folks just have a hard time battling millennia of cognitive evolution and can’t stop thinking, “What if?” What if stocks buck the odds and do terribly ahead? Let’s look at just what the odds are.
Investing is about probabilities, not certainties. There are no certainties in investing—not even in Treasurys, which can lose value in any given year. You must rationally assess probabilities of outcomes based on history, basic economic fundamentals and what you know about current conditions.
Odds are, if you have a long time horizon, stocks are likelier to outperform bonds. But what if they don’t? There have been 67 rolling 20-year periods since 1926 (as far back as we have very good US data, which can serve as a reasonable proxy for world stocks). Stocks beat bonds in 65 of them (97%). Over 20 years, stocks returned an average 881% and bonds 247%—stocks beat bonds by a 3.6-to-1 margin.5 Pretty darn good! When bonds beat stocks, however, it was by just a 1.1-to-1 margin on average—and stocks were still positive, averaging 243% to bonds’ 262%.6
In Vegas, the lower the probability, the bigger the potential payout. Yet this is the opposite of how the stock-versus-bond decision typically works. (Another reason why folks who compare investing to gambling are hugely wide of the mark.) Incidentally, over 30-year rolling periods, bonds have never beat stocks. Stocks returned an average 2,428% to bonds’ 550%—a 4.5-to-1 outperformance margin.7
So, yes, over shorter time periods, bonds on average have materially lower volatility characteristics. Some people might call that “safe.” But if your goal is to generate higher returns over long periods to increase the likelihood of achieving your goals, the shorter-term lower volatility of bonds may be less appropriate. And 20 or 30 years later, if you discover your portfolio hasn’t grown enough to meet your goals, you may not feel so safe—particularly since over that longer time period, stocks are likely to be less volatile on average.
Data and history prove stocks have had superior long-term returns. But there’s an additional reason to believe stocks are likely to have superior returns over long periods moving forward: Stocks evolve.
Stocks are a piece of ownership in a firm. Taken together, stocks represent the collective wisdom of the business world. And they represent the promise of future technological advances and future profits from those innovations.
Businesses and, hence, stocks adapt. Some businesses don’t survive. They fail—but get replaced by something newer, better, more efficient. That’s creative destruction, and it’s a powerful force for societal good.
And firms will always be motivated to chase future profits. Whatever problems get in our way—energy, food, water, disease—someone (or someones) will find ways to collide past innovations in new ways to yield something new that can knock down or at least greatly mitigate whatever problems pop up. How can you know this? Because it’s always been that way.
In 1798, the Reverend Thomas Malthus predicted food production would soon peak—there was simply no way in his (rather unimaginative) mind the world could produce enough to feed much more than a billion people. He outright rejected the notion of “unlimited progress” in food production.
Yet, six billion more people later, and in much of the developed world, the greater problem we face is obesity. Yes, in some emerging nations, famine is still a problem. But that’s nearly entirely a factor of poor governance. The world has more than enough food—we need more freedom and democracy so poor, oppressed nations needn’t rely on corrupt governments and their failing infrastructure to distribute food to the populace.
Time and again, folks with dire, long-term forecasts are proven wrong because they rely on poor assumptions that ignore future innovations and the power of profit motive. My favorite was the fellow who, in 1894, predicted London’s growing population and industry would require so much horse power, by 1950, London would be covered in nine feet of manure!8
How on earth could he have predicted the combustion-engine revolution that would soon render horse-drawn transportation a quaint relic? He couldn’t have, but he might have had more faith in the transformational power unleashed by folks eager to chase profits.
The wildly popular 1968 book Population Bomb assured us that in the 1970s, famine would kill hundreds of millions. Didn’t happen, thanks to Norman Borlaug (a guy who truly deserved his Nobel Peace prize) and his dwarf wheat—not to mention agricultural innovators who preceded him over multiple millennia.
Folks who believe ardently Peak Oil (the point at which conventional oil production peaks) will be the death of us miss this, too. Many perfectly rational folks posit conventional oil production has already peaked—some pin it sometime in the 1970s, others in the 1980s, 1990s and even more recently. Feel free to quibble with any of these. And whenever you think it happened, you can blame it on whatever you want (in the US, for example, you might blame the creation of the EPA, which put severe restrictions on production). But even if you believe we hit peak production in the 1970s, what terrible thing has happened since? In 1980, global GDP was about $10.7 trillion; now it’s about $71.3 trillion.9 Life expectancies have extended. Per capita income has skyrocketed across many emerging markets. We’ve done ok. Sure, we’ve had bear markets and recessions—some bigger, some smaller. But that’s true of any longer time period.
And known reserves of oil are double what they were in 1980, yet consumption has only, overall and on average, increased over that time. Technological advances have allowed us not just to discover more oil and natural gas, but to innovate ways to extract both from spots once thought unrecoverable.
Many Peak Oilers will argue supply has nothing to do with production. That’s merely a misunderstanding of basic economics. If the supply exists, and prices make future (conventional or unconventional) extraction profitable, producers will extract. Or innovate still more new ways to extract. Or if extraction truly becomes unprofitable (which I doubt happens for a long time), my hypothesis (based on observation of the entire history of humanity) is we’ll innovate ways to get more energy efficient. Or find substitutes. True depletion is such a long way off, we have plenty of time to innovate the next solution (or solutions). If you don’t believe that, check London, which isn’t buried under nine feet of manure.
That transformational power unleashed by profit motive is encapsulated by stocks. Bonds are fine, but they don’t represent future earnings. Bonds are a contract. You buy a bond, you get that yield—that’s it. But future earnings eventually improve, as they always have and always will—that’s captured in stocks.
Think of Moore’s Law—the idea the number of transistors on an integrated circuit should double about every two years—conceived by Gordon Moore, cofounder of Intel in 1965. There’s also Kryder’s Law, which proved in 2005 hard-drive memory storage is moving at a much faster pace than Moore’s Law—and that’s likely to continue or even accelerate! And then there’s the Shannon-Hartley Theorem, which states the maximum rate information can be transmitted over a communications channel (think fiber optics) is also increasing exponentially.
What does all that mean? We conceive of progress as linear, when it’s really exponential—and the collision of all these technologies means future innovation will move faster, as technologies conceived by people unknown to each other in far-flung locations collide in perfectly unpredictable ways to produce the next lifesaving or -improving technology or process.
If you think today’s electronic gadgets represent the pinnacle of human ingenuity, you’ll be proven wrong. I don’t know when or how, but I needn’t know—I can just own stocks and benefit. Human nature hasn’t changed enough that folks won’t be self-motivated to use their ingenuity to devise solutions to profit from problems. Always been that way. And those who profit most from innovation aren’t the technologists. No, they’re those who learn to package, market and sell those innovations—and their shareholders.