EVERY NOW AND THEN, some talking head will bluster that stock returns are unsustainable and must crash because they far outpace the US economy’s growth rate. It’s true! Long term, US GDP real growth has averaged about 3%. But US stocks have appreciated at an annualized 10% average.1 That’s a major gap betwixt. And if you believe (as many do), over time, the two rates should roughly match, then you may fear the margin between represents some sort of phantom returns. If our country’s output grows about 3% a year on average, then where the heck is that excess return coming from? Viewed that (incorrect) way, that gap is worrisome. Stocks would have to crash a long way to close that long-term annualized gap. Yikes! Except stock returns and the GDP growth rate aren’t linked. They don’t match because they shouldn’t match. Stocks can, should and probably will continue annualizing a materially higher rate of return than GDP growth. And that makes sense, if you think about what GDP is and what stocks are.
GDP is an attempt to measure national output—a wonky and imperfect one at that. It’s built on surveys and assumptions and is often restated—even years later. It doesn’t measure national assets or national wealth and doesn’t try to. Rather, it’s a standard economic flow. See it this way: As of year-end 2011, America’s GDP was about $15.3 trillion (in today’s dollars).2 If full-year 2012 GDP growth were 0% (unlikely), America’s GDP would be … still about $15.3 trillion. If America’s growth were utterly flat for five years (which would be unlikely and weird), America would have still put $76.5 trillion of output into the world at the end of those five years. And though many people believe it to be so, GDP isn’t perfectly reflective of economic health. Its headline number is calculated thusly:
GDP = Private consumption + Gross investment + Government spending + Net exports (Exports – Imports)
Gross investment is non-residential investment (you can think of that as business spending) plus residential investment plus change in inventories. Because GDP measures net exports and the US is and has been a net importer for decades, we constantly get dinged on this. Importing more than you export detracts from output but isn’t necessarily bad. It can be seen as a sign of economic health! Major developed nations that are net importers (like the US and UK) tend to have higher annualized growth rates than net exporters (like Japan and Germany). And shrinking imports isn’t a good thing. If imports fell radically relative to exports, that would actually add to headline GDP. But it’s probably a sign of graver problems, like demand collapsing in a recession. Then, too, many of the goods we import are intermediary goods. They get combined with goods manufactured here, there and everywhere. Then, they’re resold here or abroad (contributing, by the way, to headline GDP). And when US firms that imagine a product, then package, market and sell it, can import cheaper inputs, that improves profit margins, adding to shareholder value (which we’ll get to in a bit). Oh, and it allows US consumers to buy higher quality goods at cheaper prices. But GDP bean-counters can’t capture that benefit.
Then, shrinking government spending detracts from GDP. (One reason US GDP wasn’t gangbusters in 2011 and into 2012 was shrinking government spending!) But shrinking government spending isn’t necessarily a negative. Taking a longer view, it can be a positive! Consider the so-called PIIGS nations: Portugal, Italy, Ireland, Greece and Spain. Set Ireland aside for a moment—its economy is and has been structurally competitive, and its debt woes were mostly tied to its troubled banks, which the government bailed out. But for the remaining PIGS, decades of bloated government spending have crowded out the private sector—the degree of crowding out varies among nations. The private sector is a supremely smarter and more efficient spender of capital than any government—so their economies are much less competitive than much of core Europe. After all, when a business spends money, that capital comes from profit or a loan. If that spending doesn’t result in higher profits later, the business eventually ceases to be. That’s creative destruction, and it’s a powerful force for societal good. But the government isn’t subject to the forces of creative destruction. When the government spends money, first, it seizes it from you and me. That’s money, now, you and I cannot spend smartly on stuff we want or need. Or it’s money we can’t spend starting a new business. Or it’s money a business can’t spend researching cool new products or upgrading equipment or hiring or … or … or … So the government takes money out of the hands of private individuals and firms who spend it wisely pursuing their own self-interests. Then it fusses around with it a bit and spends it on something of dubious value. If the government spends money badly (as it often does) … it doesn’t go out of business. And if it needs more money later, it doesn’t have to create something of value that generates profits. It just taxes us more later! (Any private firm that operated that way would be out of business before I could finish typing this sentence.) If politicians spend money really badly, maybe some of them lose their jobs in the next election. But they just get replaced with more politicians who, again, aren’t held to remotely the same fiscal accountability as you or I or private firms are. If politicians spend money really, really badly, maybe they become Chairman of the Ways and Means Committee. So, for example, when many argue the PIIGS nations have too much debt and that’s the root cause of their problems, they have it wrong. No—there’s no level of debt inherently right or wrong or proven reliably problematic. (See Chapter 13.) The problem with those nations is decades of too much government.
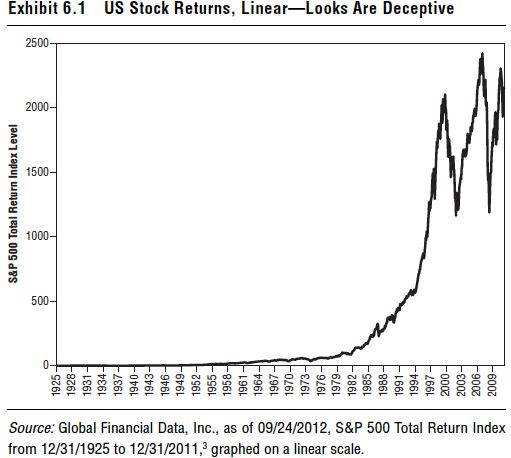
Which brings us to stocks. But bear with me for another moment before we get into what stocks are, and let’s clear up another misperception. A variation on this GDP–stock mismatch theme is that stocks have risen too far, too fast—and what goes up must fall. Typically, folks making this argument cite a chart looking something like Exhibit 6.1, which shows S&P 500 total returns over time.
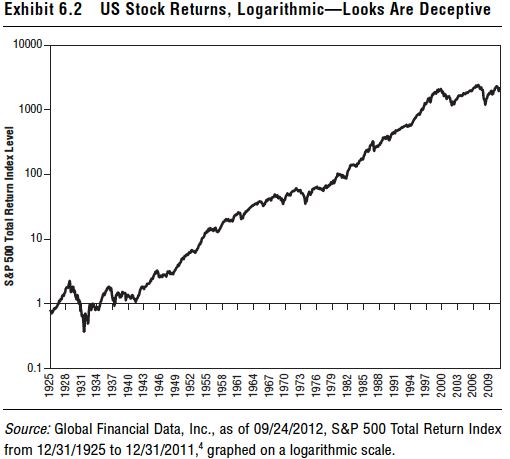
It looks like, through history, stocks had pretty steady returns. Then starting in the mid-1980s or so, stocks took off. Then getting into the late 1990s, things got super-crazy unsustainable. And then we had two big, bear markets—massive looking on this chart—which may only confirm the worst fears of those believing stocks have come “too far, too fast.” First, think about those two bear markets. They were the two biggest since the Great Depression. Now look at 1929 on the chart. Barely a blip! Weird. You already know that wasn’t reality, and something may be afoot. Now look at Exhibit 6.2, which also shows longterm returns. But this chart isn’t at all top-heavy or scary. Yet the data in Exhibits 6.1 and 6.2 are identical. The difference is the former is graphed on a linear scale and the latter on a logarithmic scale. Linear scales are fine and used all the time for measuring returns. Even for stocks they’re fine for shorter periods. The problem using a linear scale over longer periods when measuring something that compounds is every point move takes up the same amount of vertical space.
On a linear scale, a move from 1,000 to 1,100 looks huge, but a move from 100 to 110 looks tiny. Yet that’s not reality. Both are 10% moves and should look the same! Because of the impact of compounding returns over nearly 100 years, on a linear graph, later returns start looking stratospheric because the index level itself is higher. A logarithmic scale mitigates that and is a better way to consider long-term market returns. On a logarithmic scale, percent changes look the same even if absolute price changes are vastly different—a move from 100 to 200 looks the same as 1,000 to 2,000—both 100% increases. That’s how you and your portfolio experience market changes.
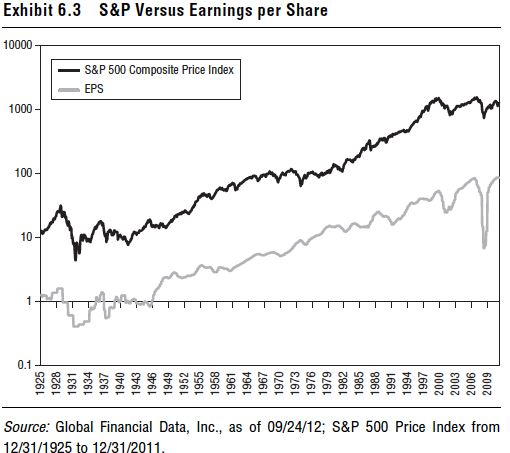
As discussed in Chapter 1, stocks are a piece of firm ownership, not a slice of current or future domestic economic output. When you buy a stock, you own a slice of a company and its future earnings, which you expect to rise over time—otherwise you wouldn’t buy the stock. Exhibit 6.3 shows S&P 500 earnings per share over time overlaid with S&P 500 price returns. Not always or perfectly, but they track pretty closely. And they should! But earnings aren’t calculated in GDP. Corporate spending is, but not earnings. Sure, one firm’s spending may contribute to another firm’s earnings. And a firm’s earnings may be influenced by whether an economy is growing or not and how strongly. But earnings are a function of revenues minus costs—and headline GDP has no direct connective tissue to either.
Public firms, i.e., stocks, function in our economy. But the stock market and the economy aren’t the same, and they aren’t remotely interchangeable. Rates of headline GDP growth and stock returns aren’t directly linked and shouldn’t be. Earnings, and therefore, stock prices, can and likely will keep growing faster than GDP over time—in the US and globally. Because stocks represent the non-stop exponential upward sweep of the collision of innovations, contributing to higher earnings over time. You can’t capture that in an economic flow.